Childcare compliance
NQF Snapshot Q1 2026: What the 933 Compliance Actions and 92% Rating Mean for Your Service
Compliance actions rose 63% year-on-year. Governance remained the weakest quality area. Here is what the latest federal data means for every Australian ECEC operator, and the workflow that keeps your service off the action list.
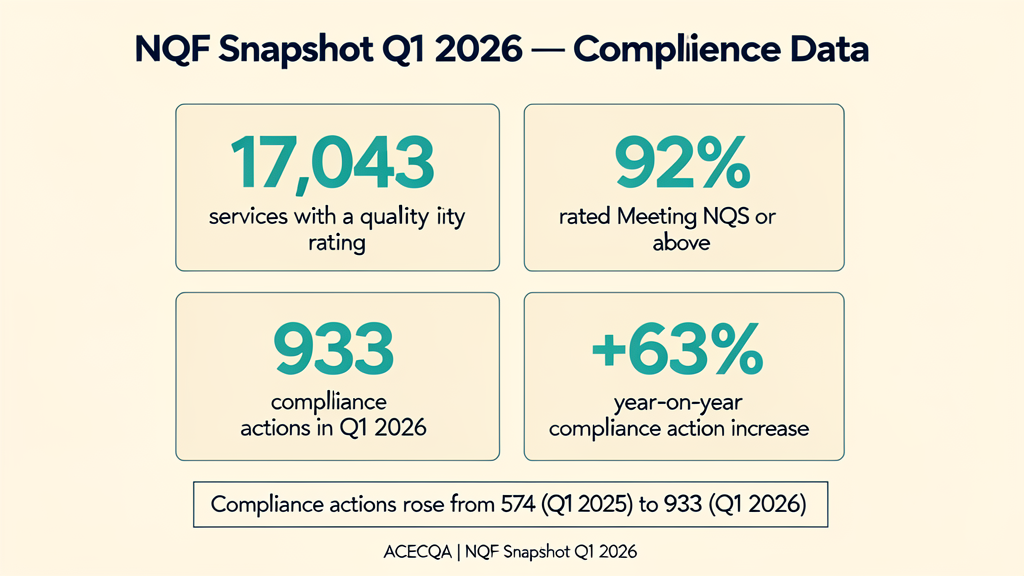
The Australian Children's Education and Care Quality Authority (ACECQA) released its 53rd NQF Snapshot on 24 May 2026. The headline figure is reassuring: 92 per cent of the 17,043 rated services are Meeting NQS or above, the fourth consecutive quarter at that level. The number buried three pages into the report is not. Compliance actions against approved providers rose from 574 in Q1 2025 to 933 in Q1 2026 — a 63 per cent increase in a single year.
For every approved provider, nominated supervisor, and centre director in Australia, the Q1 2026 Snapshot is the most important data release of the year. It tells you which Quality Areas are losing the most ratings, which compliance levers regulators are pulling hardest, and where the next round of enforcement action is most likely to land. This guide walks through every number, ranks the operational risks for each service type, and gives you the workflow that keeps your service off the action list.
The four headline numbers every operator should memorise
ACECQA's Q1 2026 Snapshot covers the period 1 January to 31 March 2026 and is the 53rd national report on children's education and care services operating under the National Quality Framework. Four numbers tell the whole story:
- 17,043 services hold a quality rating. Of these, 73 per cent are rated Meeting NQS, 19 per cent Exceeding NQS, and 24 services hold the Excellent rating (the highest tier, awarded by ACECQA's CEO).
- 92 per cent of rated services are Meeting NQS or above. This is the fourth consecutive quarter at this level — a sign of a mature, largely stable quality system. But it also means the 8 per cent who are Working Towards NQS are not moving.
- 933 statutory compliance actions were taken against education and care providers in Q1 2026. Up from 574 in Q1 2025 — a 63 per cent increase.
- 5.1 per cent of services nationally hold a staffing waiver, reflecting ongoing educator shortages, qualification pressures, and increased staffing requirements introduced in recent years.
Where the 933 compliance actions landed: a breakdown by action type
The 63 per cent year-on-year jump in compliance actions is the most important trend in the entire report. Here is the breakdown by action type, comparing Q1 2025 to Q1 2026:
- Compliance notices: 359 (Q1 2025) → 398 (Q1 2026). An 11 per cent increase — the slowest-growing category.
- Emergency action notices: 41 → 118. A 188 per cent increase — the second-fastest-growing category. These are issued when a regulator believes a serious imminent risk to children's safety exists and immediate corrective action is required.
- Approval cancellations: 7 → 133. A 1,800 per cent increase — the most dramatic category shift in the entire report. This category now dwarfs every other enforcement lever.
- Prohibition notices: 20 → 54. A 170 per cent increase — prohibition notices are issued to individuals (educators, supervisors, or volunteers) to bar them from providing education and care.
The 7-to-133 jump in approval cancellations is the single most operationally significant data point in the Snapshot. Until 27 February 2026, the federal government had no power to cancel a provider's Child Care Subsidy (CCS) approval. The new child safety legislation gave Education Minister Jason Clare that power. The Q1 2026 Snapshot is the first full quarter under the new regime, and the data tells you how aggressively the new power is being used.
Quality Area 7 Governance and Leadership remains the weakest
Quality Area 7 (Governance and Leadership) recorded the highest proportion of Working Towards NQS ratings for the second consecutive snapshot. The specific data:
- 885 services were rated Working Towards NQS in QA7.
- QA7 recorded the highest proportion of Working Towards ratings — 5 per cent of all rated services.
- The most commonly "not met" element nationally was Element 7.1.2 Management systems, with 3.5 per cent of services failing this requirement.
The other frequently unmet elements nationally were:
- Element 1.3.2 Critical reflection — 3.4 per cent not met.
- Element 1.3.1 Assessment and planning cycle — 3.3 per cent not met.
- Element 2.2.1 Supervision — 3.2 per cent not met.
- Element 2.1.2 Health practices and procedures — 3.0 per cent not met.
If you are preparing for an assessment and rating visit, this list is your pre-assessment checklist. Element 7.1.2 Management systems is the highest-risk element because it covers the systems and processes you use to manage your service — policies, procedures, records, rosters, and compliance documentation. A service that cannot demonstrate a working management system will be rated Working Towards NQS regardless of how well the children are educated or cared for.
What the service-type breakdown tells you about your own risk profile
The Q1 2026 Snapshot ranks service types by Exceeding NQS rate. The numbers tell a clear story about which service types are most at risk of compliance action:
- Preschool and kindergarten services: 50 per cent rated Exceeding NQS. Only 3 per cent rated Working Towards NQS. The strongest-performing service type nationally.
- Long day care: 16 per cent rated Exceeding NQS.
- Family day care: 7 per cent rated Exceeding NQS.
- Outside school hours care (OSHC): 6 per cent rated Exceeding NQS. The weakest-performing service type nationally.
Differences also appear across provider management types. Private not-for-profit community-managed services are rated Exceeding NQS at 36 per cent; private for-profit services at 10 per cent. ACECQA notes these differences often reflect service mix, operating models, and jurisdictional contexts, rather than simple performance gaps.
The workforce pressure signal: 5.1 per cent of services hold a staffing waiver
Workforce strain remains a defining challenge across the sector. The Snapshot shows 5.1 per cent of services nationally hold a staffing waiver, and staffing arrangements remain one of the weakest-performing quality areas. The provider landscape also remains dominated by small operators: 78 per cent of approved providers operate a single service, and only 1 per cent operate 25 or more services.
This fragmentation continues to influence workforce capability, governance maturity, and operational resilience. The 5.1 per cent staffing waiver rate is a direct consequence of the educator shortage, qualification pressure, and the increased staffing requirements introduced in recent years. For most operators, the waiver is a temporary bridge — but every day a waiver is in place is a day the service is operating below the regulatory minimum.
Educational leadership and professional development continue to feature among the most common "not met" elements nationally. If you are a nominated supervisor or educational leader, the Q1 2026 data confirms what the sector already knows: the educators are doing the work, but the leadership and governance systems around them are not keeping pace.
What the 69 per cent improvement rate means for Working Towards services
The Snapshot provides encouraging evidence that quality improvement continues across the sector. Among services previously rated Working Towards NQS and later reassessed, 69 per cent improved their overall rating. The breakdown:
- 5,190 services improved from Working Towards NQS to Meeting NQS.
- 831 services improved from Working Towards NQS to Exceeding NQS.
These results highlight the impact of continuous improvement processes, regulatory feedback, professional support, and strengthened educational leadership. The system rewards operational improvement — but only when the improvement is documented and reassessed. A service that makes improvements internally without notifying the regulator and triggering a reassessment visit will not see the rating change.
How NovoCove handles this
The Q1 2026 NQF Snapshot is a national dataset, but every service in the country has a personal risk profile within it. NovoCove turns that dataset into an operational compliance workflow. Every policy, training record, staff qualification, incident report, and assessment evidence is timestamped, searchable, and exportable as a Quality Area evidence pack in minutes — not days.
The four elements ACECQA flagged as the most commonly "not met" — Element 7.1.2 Management systems, Element 1.3.2 Critical reflection, Element 2.2.1 Supervision, and Element 2.1.2 Health practices — are exactly the four areas the NovoCove dashboard tracks by default. Every staff member's qualification expiry, every policy review date, every incident report, and every critical reflection entry is attached to the relevant NQS element and the relevant Quality Area. When an assessor arrives, you surface the evidence in seconds.
The 933 compliance actions in Q1 2026 are not a forecast of regulator behaviour — they are a record of it. The 7-to-133 jump in approval cancellations is the new normal under the federal CCS-cancellation power. Services that document, timestamp, and evidence every compliance activity are the services that stay off the action list. Book a 20-minute demo and we will run your service name through the same Q1 2026 Snapshot lens the regulators use.
This guide is general information and is not legal advice.